The problem, named
Friction Architecture™: The conditions that quietly suppress performance
It isn't on your org chart. It isn't in your engagement survey. It is in how work actually happens - and it is costing you more than you can see.

What is Friction Architecture™?
Friction Architecture™ is the structural conditions, never deliberately designed, that suppress how well people can perform. It is the accumulated set of priorities, decision rights, workflows, information flows and people systems that shape everyday work - and that quietly use up the attention, judgement and energy capable people need to do their best work.
The term names two things at once. Friction, because the effect is drag: effort that is spent but never reaches the work. Architecture, because the cause is structural: it is built into how the organisation operates, and it can be redesigned.
Assembled, not designed
No one sets out to build friction into an organisation. It accumulates. An approval step is added after a mistake. A reporting line is redrawn around a strong individual. A new tool arrives alongside the old ones. A priority is added, and nothing is taken away to make room for it.
Each decision made sense at the time. Few were revisited. None was designed as part of a whole. Over years, they combine into an environment that nobody chose - and that everybody works inside.
Growing organisations feel this first as things that "used to just work" and no longer do: when everyone sat together, proximity did the design work, and scale has taken proximity away. Larger organisations feel it as the opposite - layers of process, each reasonable on its own, that together turn simple things into slow ones.
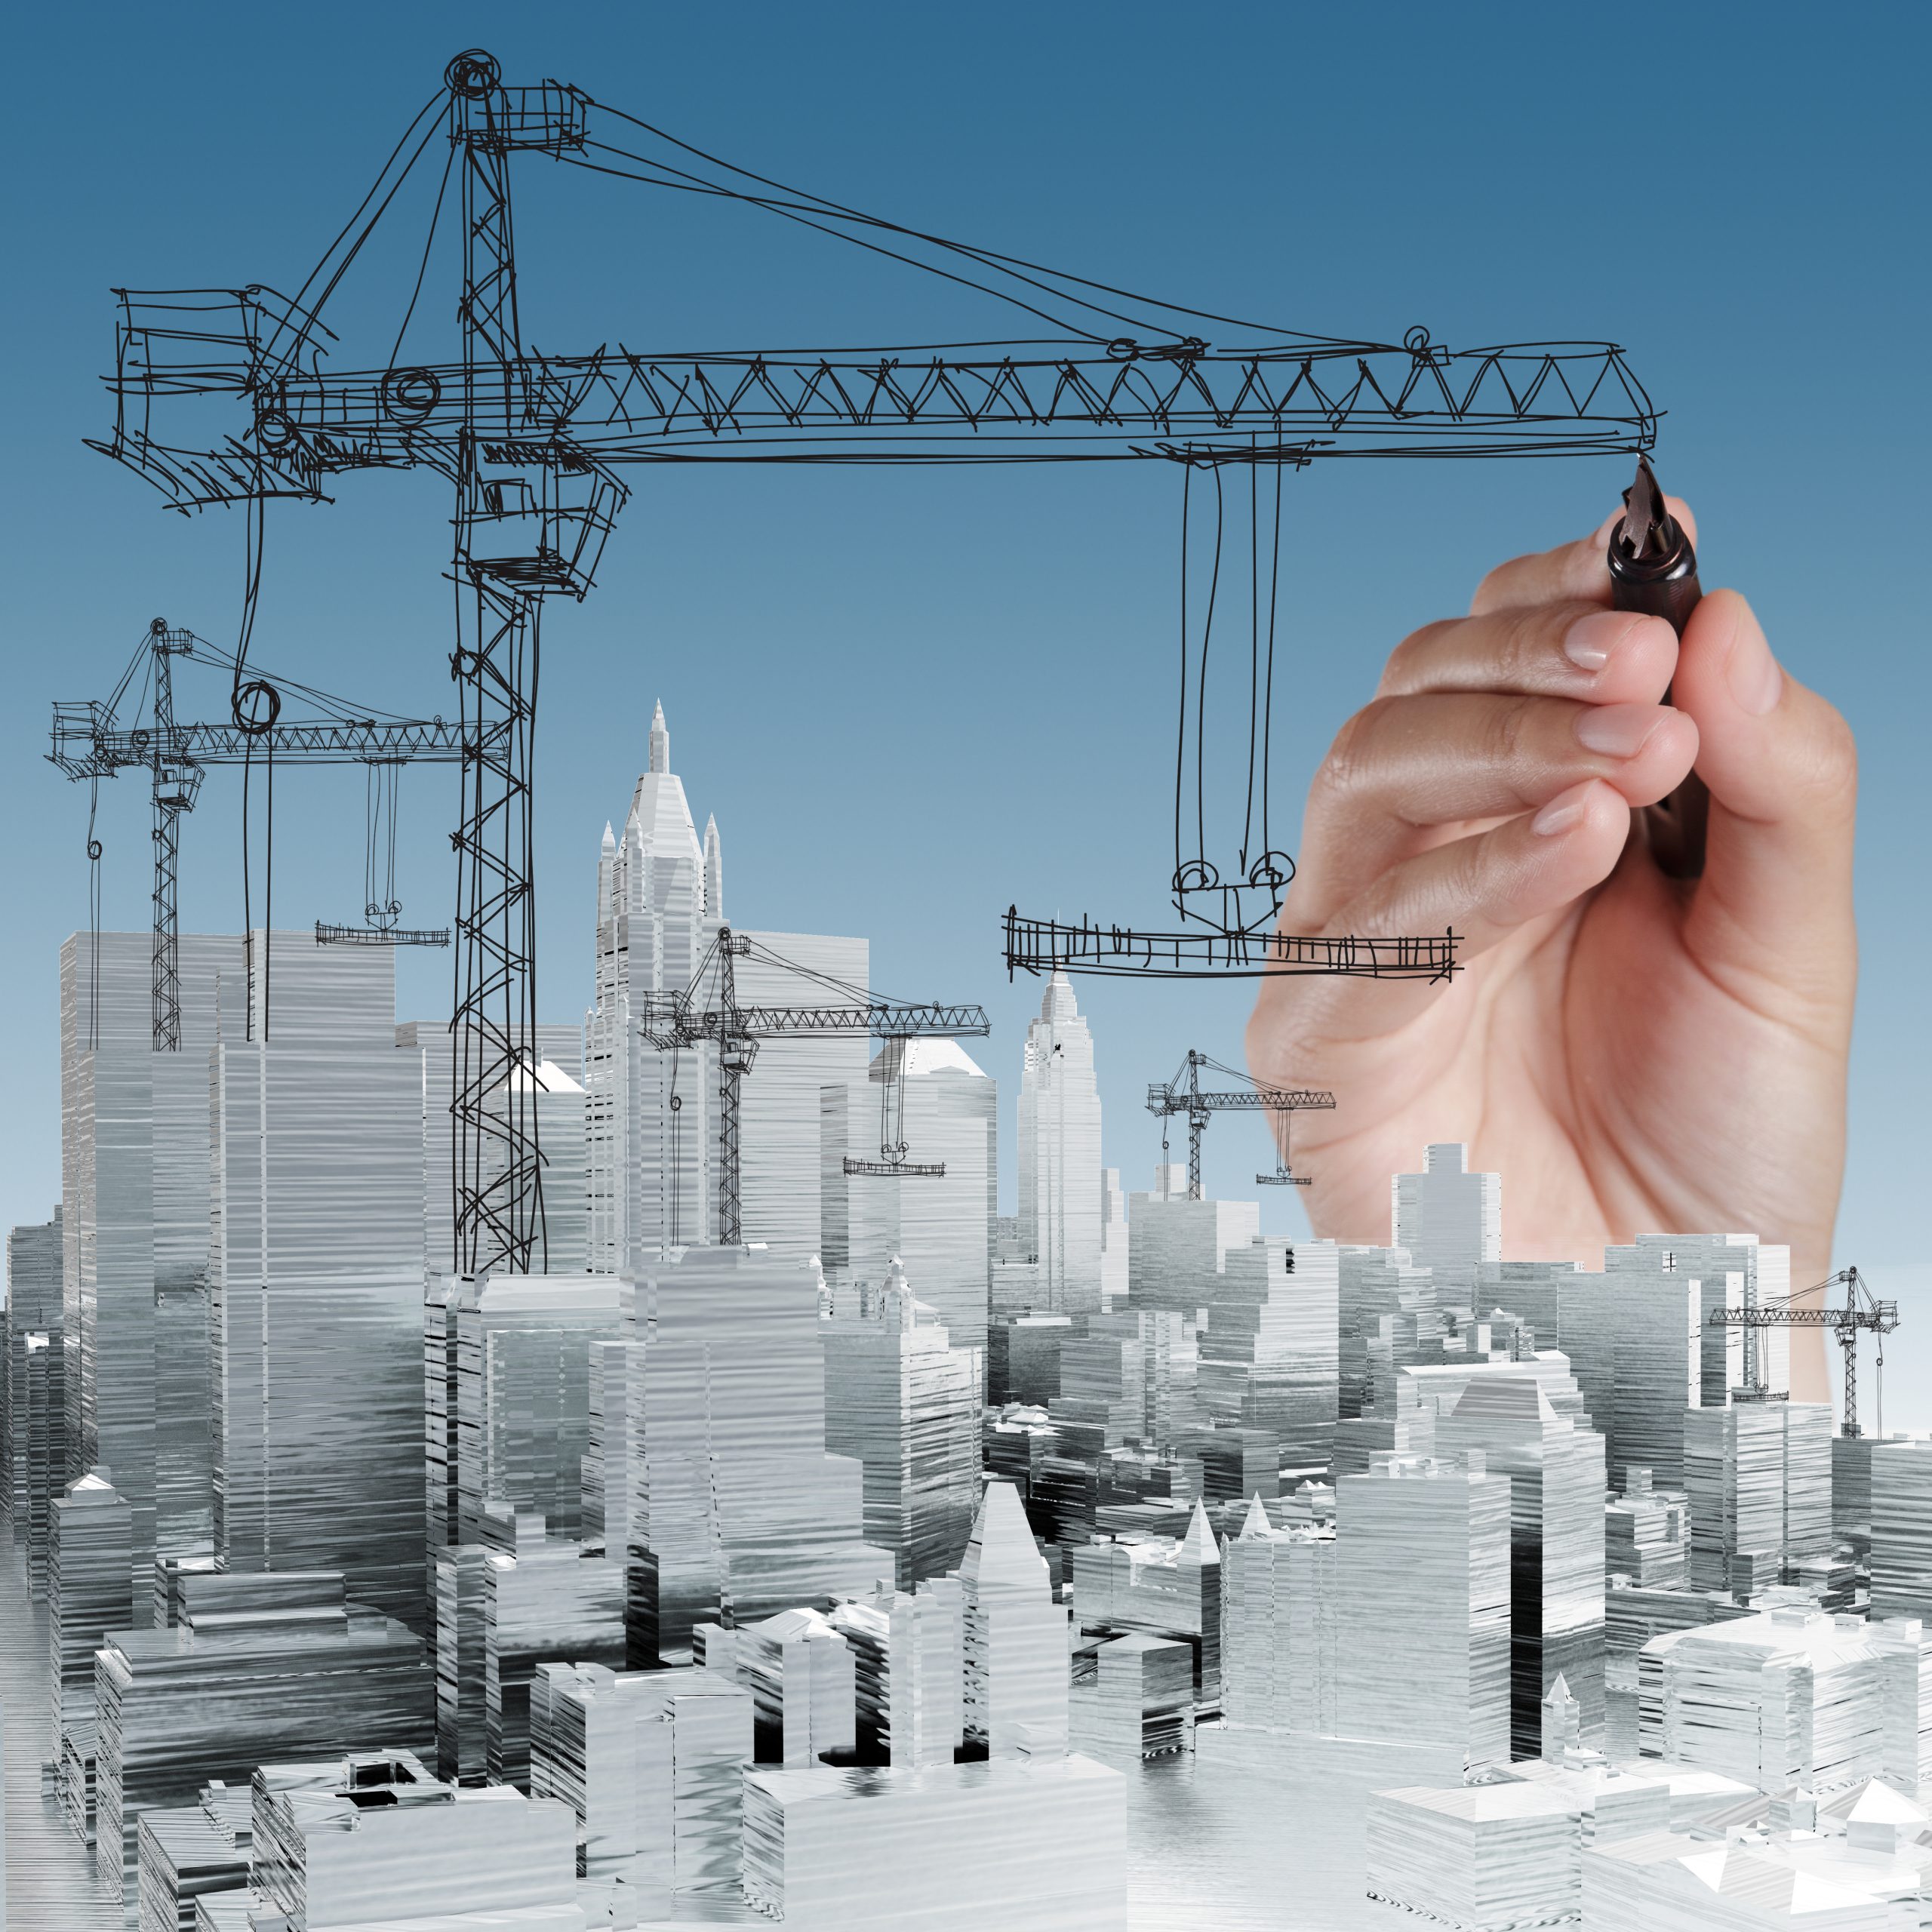
“A building doesn't perform badly because the people inside it are unmotivated. It performs badly because it was designed badly. Organisations are no different.”
Why you can't see it
Friction Architecture™ doesn't appear in the places leaders look. The org chart shows reporting lines, not how decisions actually travel. The engagement survey shows how people feel about their conditions, not what those conditions are. The financials show the outcome, not the drag that produced it.
So the symptoms get attributed to people. A team that misses its targets needs better leadership. A manager who escalates everything needs more confidence. An organisation that resists change needs a culture programme. The investment goes into the people - who then return to exactly the same conditions they left.
That is why the same patterns keep coming back, even with different people in the roles. When a problem survives a change of personnel, it is telling you something about the system.
Where it lives: Seven organisational systems
Friction is produced by the systems every organisation runs, whether or not anyone designed them. These are the places where design decisions are made - often by default.
Strategy & Priorities
How priorities are set, how trade-offs are made, and whether anything ever stops.
Governance, Decision Rights, Controls & Accountability
Who can decide what, how far decisions travel, and whether authority matches accountability.
Structure, Roles & Interfaces
How responsibility is divided across roles and teams, and who owns the space between them.
Work Design, Technology & Operating Environment
How work is organised, paced and supported by tools and the working environment.
Information, Communication & Sense-Making
Where the current answer lives, how information is filtered, and how signals become shared understanding.
People Systems, Incentives & Access
How people are selected, assessed, rewarded and given access to opportunity - and what that teaches them counts.
Change & Transition Design
How change is sequenced, introduced and allowed to settle before the next one arrives.
None of these operates alone. Friction in one system routinely shows up as a problem in another, which is why fixing a single process rarely changes much on its own.
What it does to people: Six neural conditions
Everything an organisation achieves runs through human brains, and the brain responds to its environment before it responds to instructions. When conditions are right, judgement, creativity and cooperation are available to the work. When they are not, the brain treats ambiguity, lack of control and sustained overload much as it treats other threats - and the capability you most need is the first to go.
Our work is built on six conditions that determine how well people can perform. They describe the environment, not the individual.

Clarity
Knowing what matters, what is expected and where things stand. Suppressed when priorities shift without explanation or there are several versions of the answer.
Agency
Having real influence over your work and the decisions that shape it. Suppressed when people are accountable for outcomes they have no authority to affect.
Capacity
Having the attention and headroom to do the work well. Suppressed by fragmented days, constant interruption and more priorities than anyone could deliver.
Safety
Being able to speak up, challenge and take sensible risks. Suppressed when raising a problem visibly costs the person who raises it.
Adaptability
Being able to learn, test and adjust as things change. Suppressed when there is never time to reflect and every failed test is treated as poor performance.
Collaboration
Being able to think and work well with others across boundaries. Suppressed when teams are rewarded for local success and nobody owns the handoffs.
The Friction Tax
The Friction Tax is the productive capacity an organisation loses to conditions it never deliberately designed. It doesn't appear on the P&L. It shows up in every meeting that didn't need to happen, every decision that travelled further than it should, every piece of rework, and every capable person working around the system instead of through it.
It isn't a measure of how hard people are working. People are working hard. It measures how much of that effort the system absorbs before it reaches the work - and expressing it in financial and FTE terms turns a vague sense that "something is off" into a number a board can act on.
The Friction Tax calculator gives you an indicative figure in three minutes. The Friction Architecture™ Profile gives you a more accurate one, built from your own organisation's data, with a clear view of where it is being collected.
Why programmes don't fix it
Most organisations have already invested seriously in improvement: leadership development, engagement initiatives, restructures, new tools. Those investments were not wrong. They built real capability. But they operated above the layer that needed to change, so people returned to the same conditions and, over time, to the same patterns.
Behaviour is downstream of conditions. Change the conditions and behaviour changes durably, because the system is different. Toyota did not tell its workers to care more about quality; it gave any worker on the line the right to stop it when they saw a problem. The expectation was the same as everyone else's. The design was different.
“If the water pressure drops, you don't run a training programme on using water more efficiently. You look at the pipes.”
How to make it visible
Friction Architecture™ can be measured. The Friction Architecture™ Diagnostic is a short, evidence-based questionnaire completed by a cross-section of your organisation. It asks people to weigh evidence about how work actually happens, not to report how they feel.
You then receive your Friction Architecture™ Profile: where friction sits across the six neural conditions, the seven organisational systems most likely to be producing it, your Friction Tax, and where to focus first. From there, the Redesign Studio is where leaders redesign those conditions - one focused experiment at a time.
Questions leaders ask
Isn't this just culture?
Culture is what we call the pattern when we haven't yet looked at what produces it. Friction Architecture™ is the structural layer underneath: how decisions, priorities, work and information are actually set up. Change that layer and behaviour changes with it. Run a culture programme without touching it, and you tend to get a temporary lift followed by reversion.
How is it different from organisational design?
Most organisational design works on the visible structure: reporting lines, spans and layers. Friction Architecture™ includes structure but goes beneath it, into the conditions no one drew on the chart - how decisions travel, where the current answer lives, how work crosses between teams. It is the design that happened anyway.
How is it different from an engagement survey?
An engagement survey measures how people feel about their conditions. The Diagnostic reads what those conditions are, and traces them to the systems producing them. One is a sentiment read; the other is a structural read with a redesign brief attached. They work well side by side.
Can it really be measured?
Yes. The Diagnostic produces a scored, comparable Profile from your own organisation's data, and a baseline you can re-measure through the annual health check. We are running a validation partnership with the University of Edinburgh Business School, and testing the Diagnostic as a leading indicator of the outcomes organisations already track.
Who is it for?
Organisations from around 50 people upwards where the gap between ambition and performance persists despite doing the right things. In growing organisations the pattern is usually under-structure; in larger ones, over-structure. The underlying problem is the same.
Is this about AI?
No, though AI makes it more urgent. AI accelerates the pace of work; it doesn't redesign the conditions in which decisions are made. In an organisation with high friction, it tends to surface the problems faster.
Every leader is an architect
The question isn't whether you are designing your organisation. It is whether you are designing it deliberately.